
Column interaction diagrams for circular sections: Part 2
The benefits of turning it into a program
In Part 1 of our discussion about interaction curves, we covered the general theory for determining capacity by hand. If you missed it, you can catch up here.
Capacity reduction
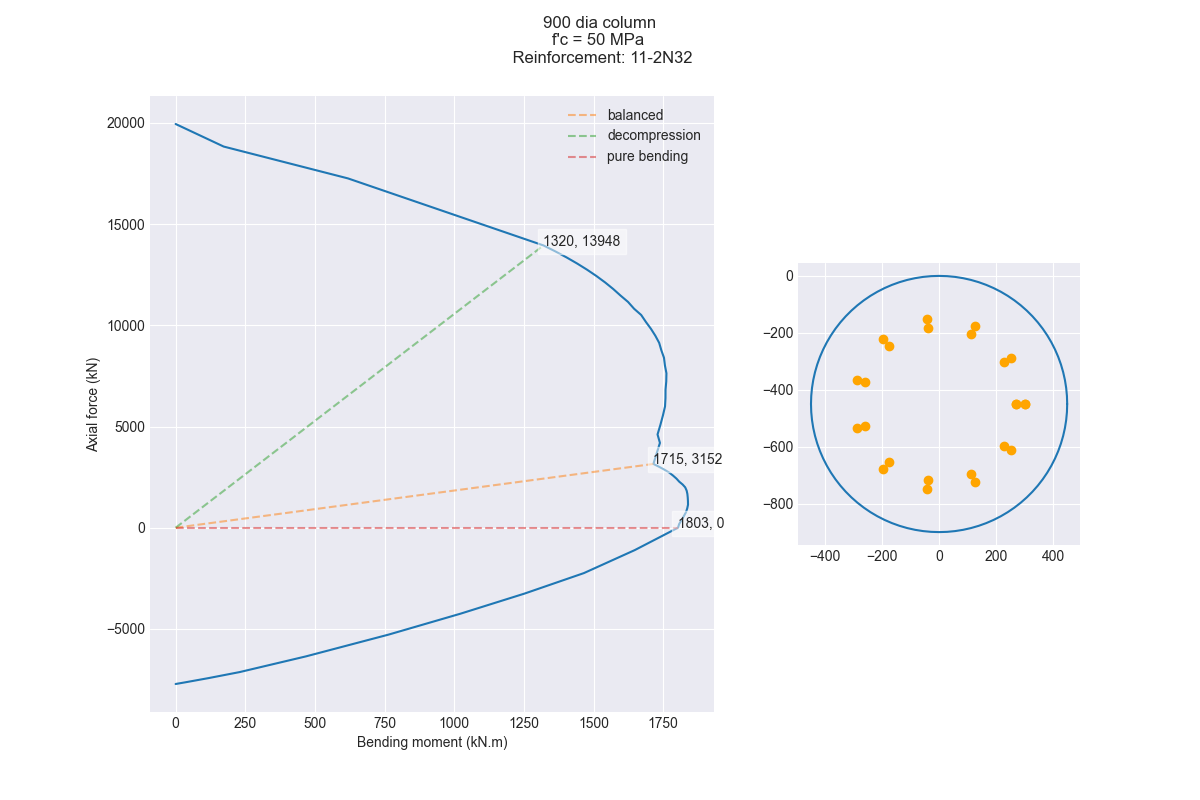
The final part of generating the curves is to apply a capacity reduction factor to each of these forces and moments. Here is where our balance point comes back in from before.
The capacity reduction factor will vary as we change neutral axis depth. The balance point becomes the dividing line for determining the capacity reduction factor.
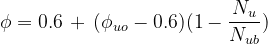
Per AS 5100.5-2017, for k values “above” the balance point, or more generally, when


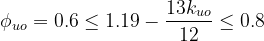
When we are “below” the balance point, but still in compression overall:
Where:
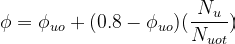
And finally, when the section experiences tension:
Programming the interaction curve
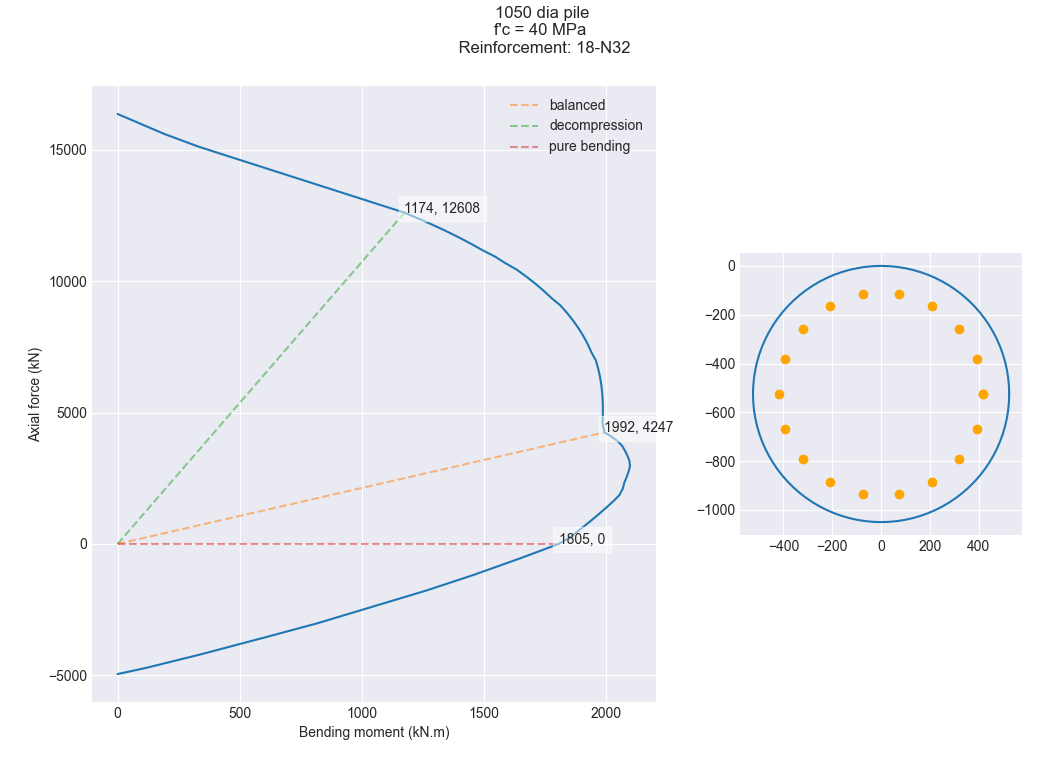
Turning this process into a program does take a bit of effort. But it’s worth the work for the speed and simplicity.

Three lines of code to generate a complete column interaction curve? Not too shabby. Time taken? About 3 seconds.
Say we wanted to deal with bundled bars and a different concrete grade? 2 more lines.

The set-up work is not quite that simple of course. There are a few hundred lines of code which go into the backend to prepare this.
This is all fantastic for the person who developed the script, because now I’m able to generate highly customised interaction diagrams within a few seconds, changing various parameters as required.
There are a number of very critical drawbacks of writing code like this, however.
Engineers are not programmers
While computer science is becoming more popular in the engineering industry, very very few of us are professionally trained in programming. Those that do have capabilities are largely self-taught.
The code written by those of us code is generally poorly documented. This makes it hard for someone with a programming background to follow. Someone with a non-programming background? Fuhgetaboutit.
Because so few of us know how to program, and those that do are generally younger and less experienced, it’s hard to get scripts verified. How do we know they’re working as intended? One small mistake in the code can have a drastic impact on the conclusion. The only practical way at the moment seems to be verification by comparison. Rather than trawling through the lines of code, we generate some example designs and then compare these with software packages we trust.
You’ve written the perfect script
Okay, so ideally you’ve written a script which has no bugs and functions exactly as intended. You’ve compared the outputs to some other software and it matches up well. You even had one of your colleagues review the source code and give you the tick of approval. Your other colleagues think this script is fantastic and want to use it.
How do you share it?
Unless you’ve written the script in VBA, this is a problem.
Because most of your colleagues will not know how to run scripts, we need to package things into something a little more user-friendly. And because we’re programming, we need to manually add these user-friendly features ourselves.
What was a simple script to make your life easier is now turning into a piece of software.
This is fine, of course, and is how most of the commercial software we use today began. But it makes it hard to find a middle ground.
Perhaps the most useful aspect of preparing a program is that you (the programmer) gain a much deeper understanding of the concepts you’re modelling.
If you have any questions on programming, generally, or specifically relating to column interaction diagrams, feel free to reply to this email or leave a comment. ✌